Analysis of Apache Guacamole
Overview
This post will be focusing on an analysis of Apache Guacamole’s web traffic. From their website:
Apache Guacamole is a clientless remote desktop gateway. It supports standard protocols like VNC, RDP, and SSH. We call it clientless because no plugins or client software are required. Thanks to HTML5, once Guacamole is installed on a server, all you need to access your desktops is a web browser.
This open-source product makes it very easy to connect to your home devices across a variety of protocols, such as RDP, all over a standard web connection. This traffic is protected when employed with TLS, however more and more organizations are beginning to employ next-gen firewalls capable of TLS decryption and content inspection. This raises the question: what exactly would they see if they could decrypt a guac session? I would guess that guac user/pw authentication would be visible in plaintext, but what else? With a visit to Google, I can’t find a single resource that provides this kind of analysis. We’ll just have to take a look for ourselves!
Data Collection & TLS Decryption
For this analysis, I am running Apache Guacamole 0.9.14 with relatively standard configurations. This is on a webserver that only allows HTTPS.
For this analysis, I’ll start by running Wireshark to collect a packet capture of some standard guac usage (login, select a device, and use it to open some apps, move the mouse around, and type on the keyboard). Since my guac is configured to run via HTTPS only, this capture is primarily going to be encrypted data. Since we’re going to simulate an organization decrypting TLS traffic, we first need to do some prep work. The only actions you need to take are on your client, not on your guac server itself.
First, edit your user environment variables. Create a variable named “SSLKEYLOGFILE” and set it to any file path where you want the browser to output the symmetric encryption keys (e.g., “C:\users\bob\keys.txt”). Now simply open up your browser and navigate to any HTTPS website; you should see the file filling automatically. No config changes in the browser are needed.
To enable Wireshark to decrypt HTTPS using these keys, click the Edit menu, then Preferences. Expand the Protocols section, and scroll all the way to TLS and select it. You now should see a Browse option under “(Pre)-Master-Secret log filename”. Browse for your key log file and hit OK. Wireshark will now be able to decrypt all HTTPS/TLS sessions in your PCAP.
Analysis
To keep this post relatively short, I’m just going to post about interesting findings, rather than a complete analysis.
Guac Authentication
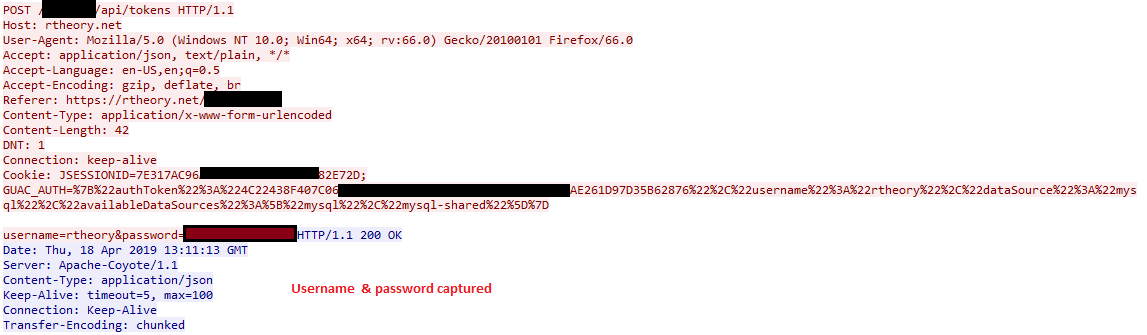
The first finding is not a surprise. The username and password used to login to guac are visible as plaintext.
Device Listing
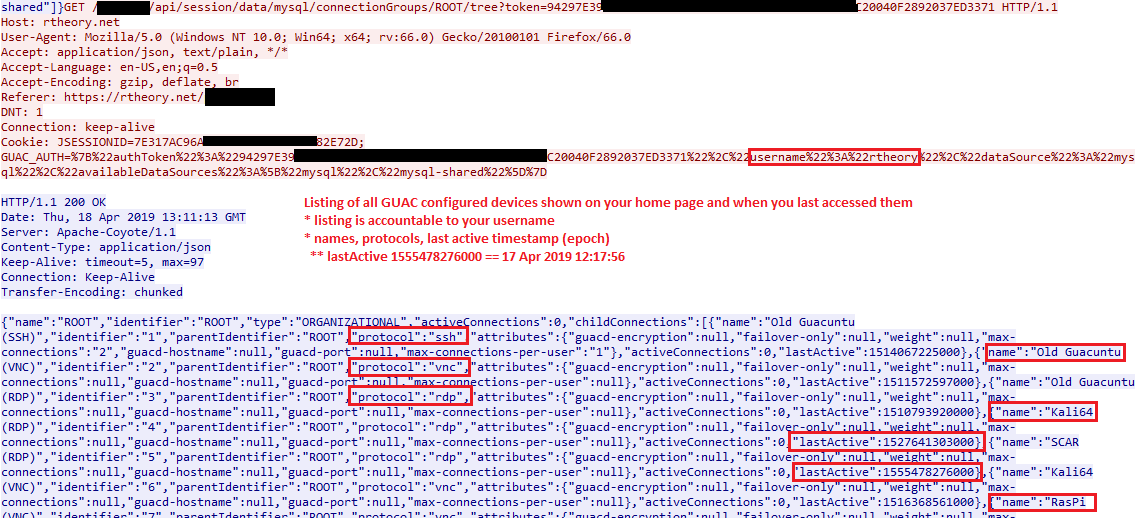
When you login to guac, you are presented a listing of your configured devices. Thus with TLS decryption, an investigation of this web traffic would see this. Also shown for each device is when you last connected to them.
Connection to a device
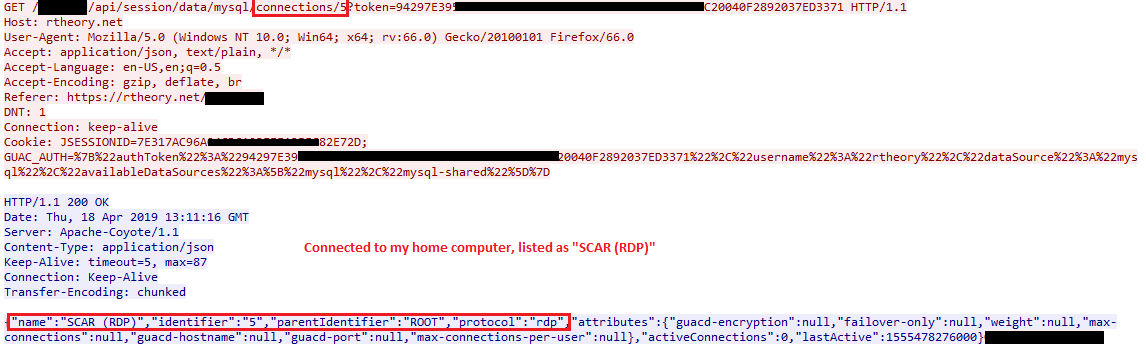
Web traffic clearly shows when you connect to one of your devices, passing its name, ID, protocol, amongst a few other attributes. As with all other guac web requests, your username is included due to it being in the cookie, adding some nonrepudiation to each step (unless you can show your account was compromised).
Key Logging & Mouse Logging
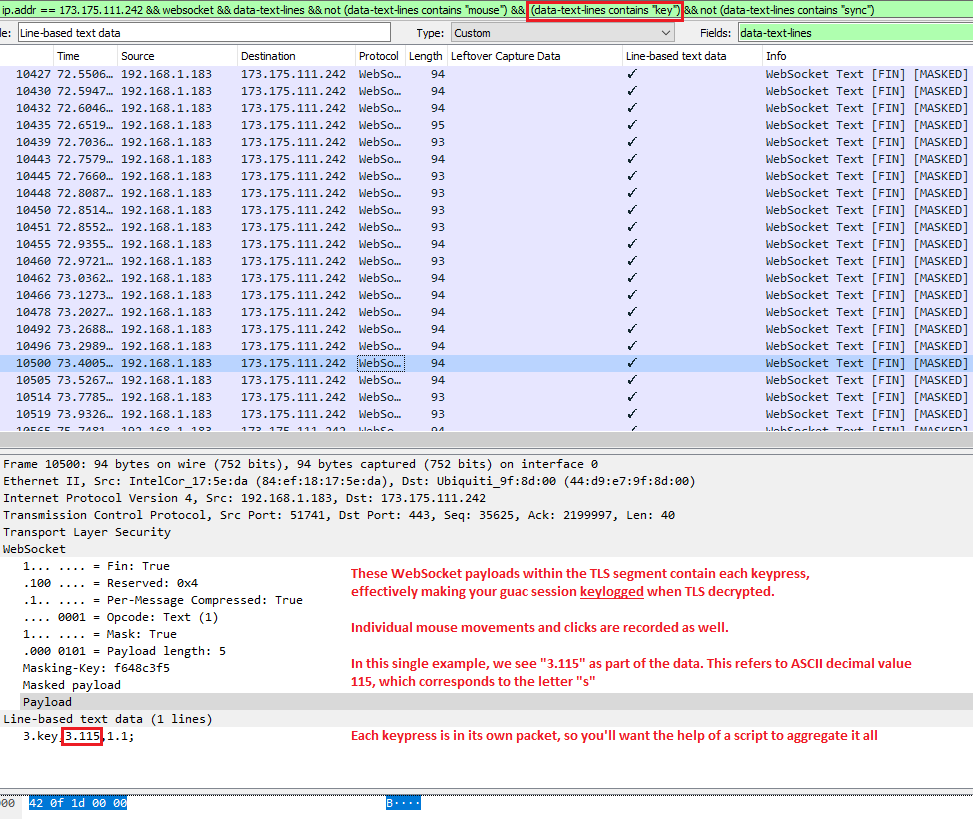
At this point, there isn’t a lot left for the web requests. By this stage, our RDP/VNC/etc session is presented to us, and we are now operating within a web socket. If we redirect our pcap analysis to look at the web socket traffic, there is some more information we can start to extract. I’m sure we could go extremely deep with this (such as eventually building out the graphical image displayed of your session), but so far I’ve been able to extract keypresss and mouse movements.
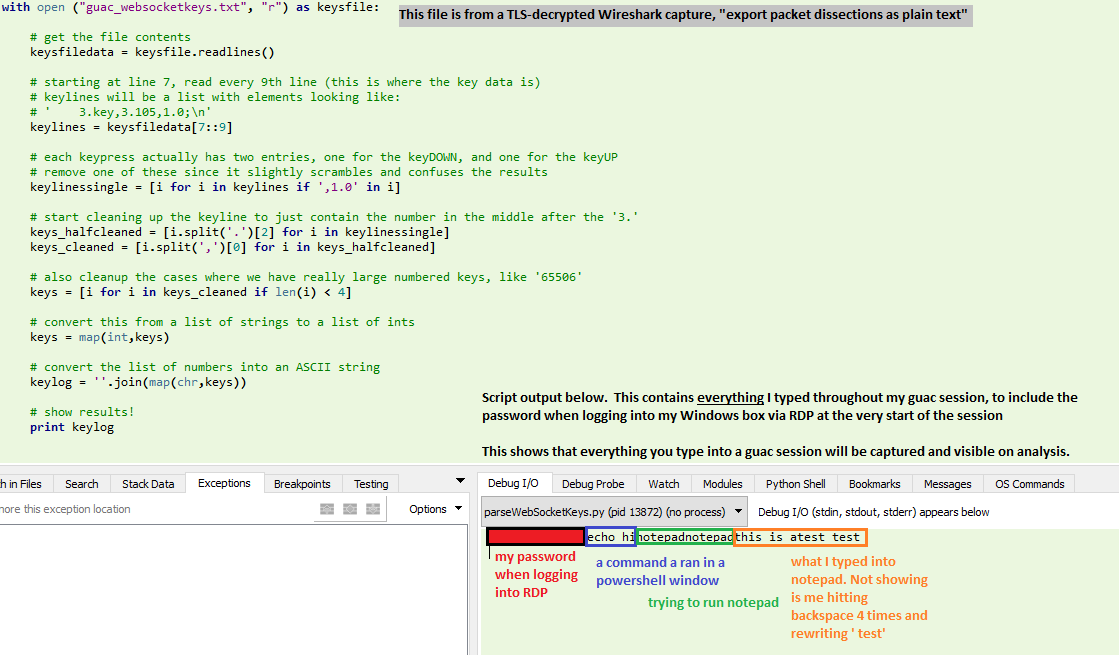
Each time you press a button on your keyboard in a guac session, a packet has to be sent to indicate this on the remote end (actually, two: one for keyDOWN and one for keyUP). We can filter Wireshark to just show these key events with the filter:
websocket && data-text-lines contains "key"
I put together a python script to aggregate all this data and present a text output of everything I typed while in my guac session. My guac session consisted of me logging into my Windows box via RDP, clicking open powershell and typing “echo hi”, attempting to find and run notepad, and then typing “this is atest” into notepad (followed by a few backspaces and “ test” to fix my typo).
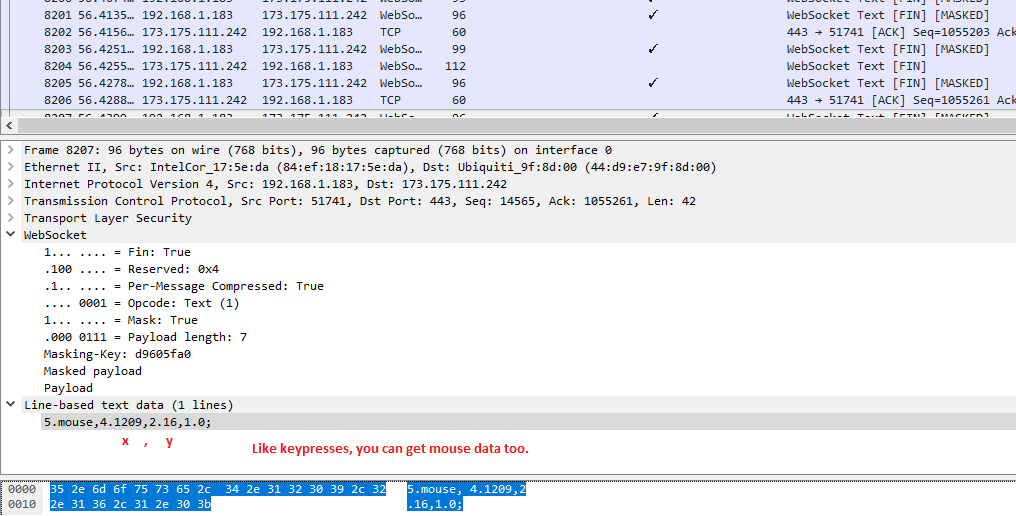
Next, we can also see some mouse movement information within the websocket data.
I created a script to aggregate these coordinates and plot them. It did indeed plot the exact path that my mouse took (I drew a square and then a star with my mouse before moving to reopen wireshark and stop the capture)
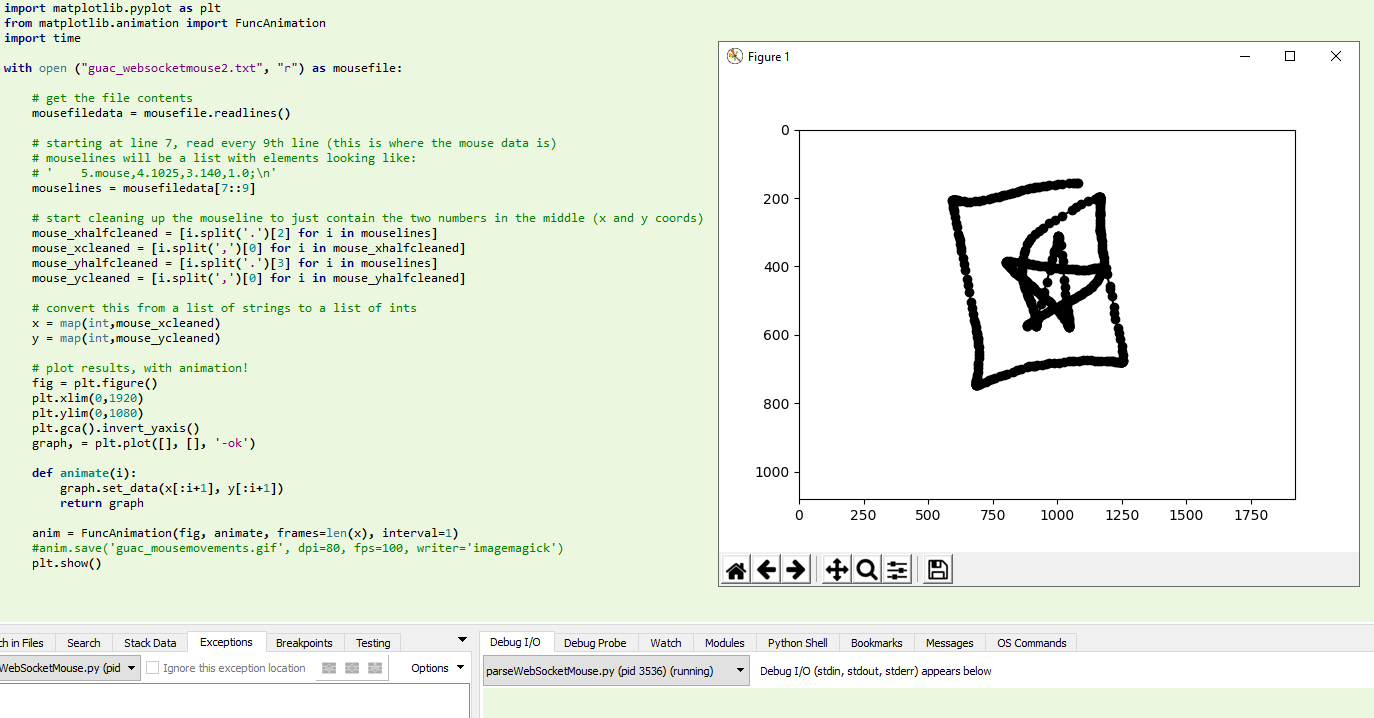
Here is an animated plot of the mouse movements extracted from the packet details:
Shared Clipboard Content
The shared clipboard contents can also be viewed if it was used during the session. This is the clipboard when you press CTRL+SHIFT+ALT. The WebSocket payloads will first contain one that says “clipboard,” followed by a payload like the one below with the actual content:
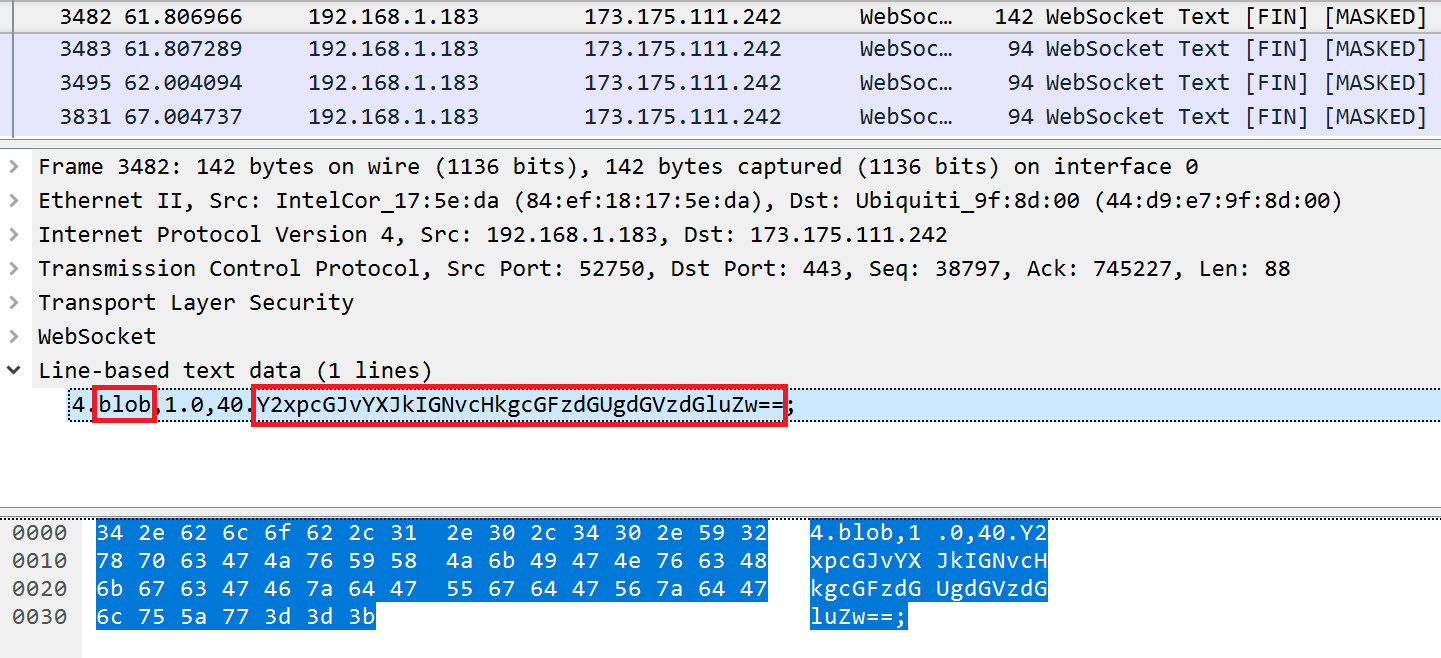
You just need to convert it from Base64 to ASCII:

Screen Imagery
Of course the most bandwidth consuming part of this traffic is the transfer of imagery from the remote end to the client, ultimately displaying the user’s session in the browser window. This imagery can be compiled and viewed as well, though Wireshark’s websocket dissector seems to be unable to correctly reassemble most of these packets. If you try this, you will likely see an error: “Decompression Failed.” Since it cannot successfully perform a zlib inflation, you won’t be able to see the websocket payload.
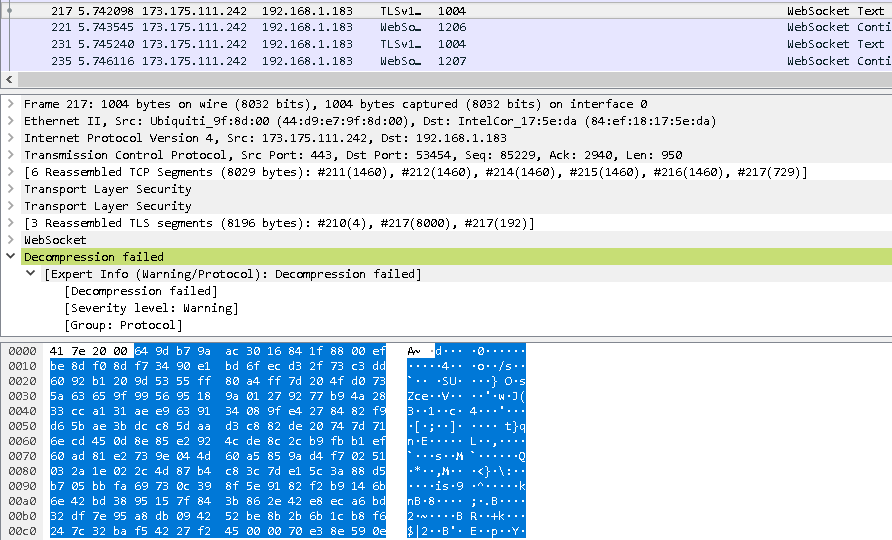
In all of my tests, I found that it was able to show one partial example of an image transfer before hitting the decompression failure. Here is what that looks like, and what all image transfers would look like if the dissector could display them to you:
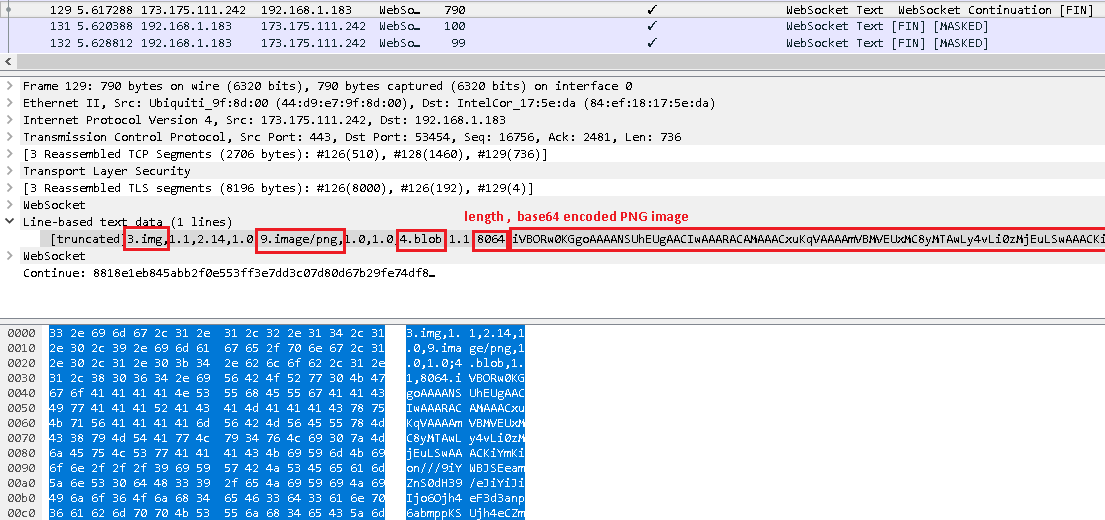
This shows that imagery is transfered as a PNG in base64 encoding for an RDP connection. If needed, the PNG is split into blocks that are 8064 bytes at maximum. Each block of the PNG will start with “4.blob” followed by the size of the block (1-8064), followed by the base64 data up to that length. When the final block of the image is done transferring, “3.end” will be sent.
Understanding this, we can manually reassemble any image where we have this full stream of traffic. Wireshark may not be able to dissect these payloads, but there are other ways of viewing them. Chrome’s Dev Tools has built-in support for viewing websocket messages, but unfortunately it does not allow you to save a copy of all of these to a file (you can only do one message at a time). This is fine for rebuilding and analzying a single image, but it won’t work for scripting the recovery of all images in a session. Similarly, there are some addons for FireFox that will let you view these messages, but they also do not have a function to save all of them. I also tried a few other tools, such as WSSIP as a proxy. In general, there are a lot of useful tools to view websockets messages, but I’ve yet to find any that will export them to enable some scripting.
Update: it’s a bit convoluted, but I have finally figured out a way to save all these websocket messages. Basically, you need to start up a Chrome DevTools Inspector on your original inspector that’s recording the websockets. Using the second inspector, you’ll be able to use Chrome’s API to gather and save these messages to files. Let’s give this a try.
- Open a blank Chrome tab
- Hit F12 to bring up DevTools
- Within DevTools’ options, set “Dock side” to be a separate window
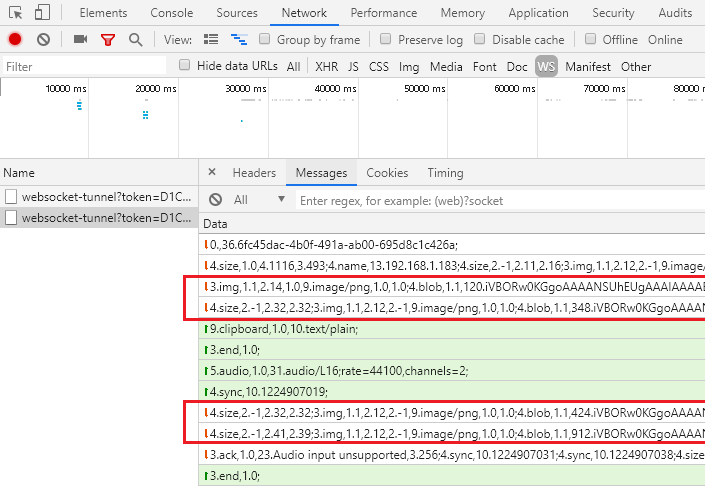
- Within DevTools, click the Network tab and click “WS” to just monitor websockets
- In your Chrome tab, navigate to your Guac server and login to one of your devices. I connected to my laptop via RDP
- Within DevTools, you see your websocket-tunnel listed. Click it to select it. You will now see messages like in the image above. If you hover your mouse over your guac instance while watching these messages, you’ll see lots of “5.mouse” events populate.
- Within DevTools, press CTRL+SHIFT+J to open a second DevTools window that is attached to the first
- Within the new DevTools, paste the following code to download each websocket message to a file. Note: this will fill your default download directory with hundreds of small .txt files
	// Javascript 'console.save(data, filename)' function to write data to a file

	// Credit: https://bgrins.github.io/devtools-snippets/#console-save

	(function(console){
	  console.save = function(data, filename){
		if(!data) {
		  console.error('Console.save: No data')
		  return;
		}

		if(!filename) filename = 'console.json'

		if(typeof data === "object"){
		  data = JSON.stringify(data, undefined, 4)
		}

		var blob = new Blob([data], {type: 'text/json'}),
		e = document.createEvent('MouseEvents'),
		a = document.createElement('a')

		a.download = filename
		a.href = window.URL.createObjectURL(blob)
		a.dataset.downloadurl = ['text/json', a.download, a.href].join(':')
		e.initMouseEvent('click', true, false, window, 0, 0, 0, 0, 0, false, false, false, false, 0, null)
		a.dispatchEvent(e)
	  }
	})(console)

	// Javascript implementation of sleep

	function sleep(ms) {
	  return new Promise(resolve => setTimeout(resolve, ms));
	}

	// Loop through all network requests, gathering the _url property which contains websockets image data

	// Sleep is mandatory; Chrome won't let you save files as fast as this script will run without it

	var i
	var reqs = SDK.networkLog.requests()
	for (i = 0; i < reqs.length; i++) {
	  console.save(reqs[i]._url, "test".concat(i).concat(".txt"))
	  await sleep(100)
	}
9. To cleanup the files, I used this Bash one-liner via WSL. It loops over all the “urls*.txt” files and combines them into one file, line-separated:
for f in urls*.txt; do (cat "${f}"; echo) >> compiled_msgs.txt; done10. You can delete all the urls*.txt files now if you like. Open compiled_msgs.txt with something like Notepad++ to verify you have all the data, one message per line.
11. Run this Python script to go through each of these lines and recreate the corresponding PNG image. This will write them into a folder names “imgs”
    import base64

    with open('compiled_urls.txt', 'r') as f:
    	textlines = f.readlines()
    	i = 0;

    	for textline in textlines:

    		if textline.startswith("data:image/png;base64,"):

    			imgb64 = textline.split("data:image/png;base64,")[1]
    			img = base64.b64decode(imgb64)
    			imgname = 'imgs/img'+str(i)+'.png'

    			with open(imgname, 'wb') as imgfile:
    				imgfile.write(img)

    			i = i+1
12. Check your imgs folder, where you now have every PNG image that went across the websocket.
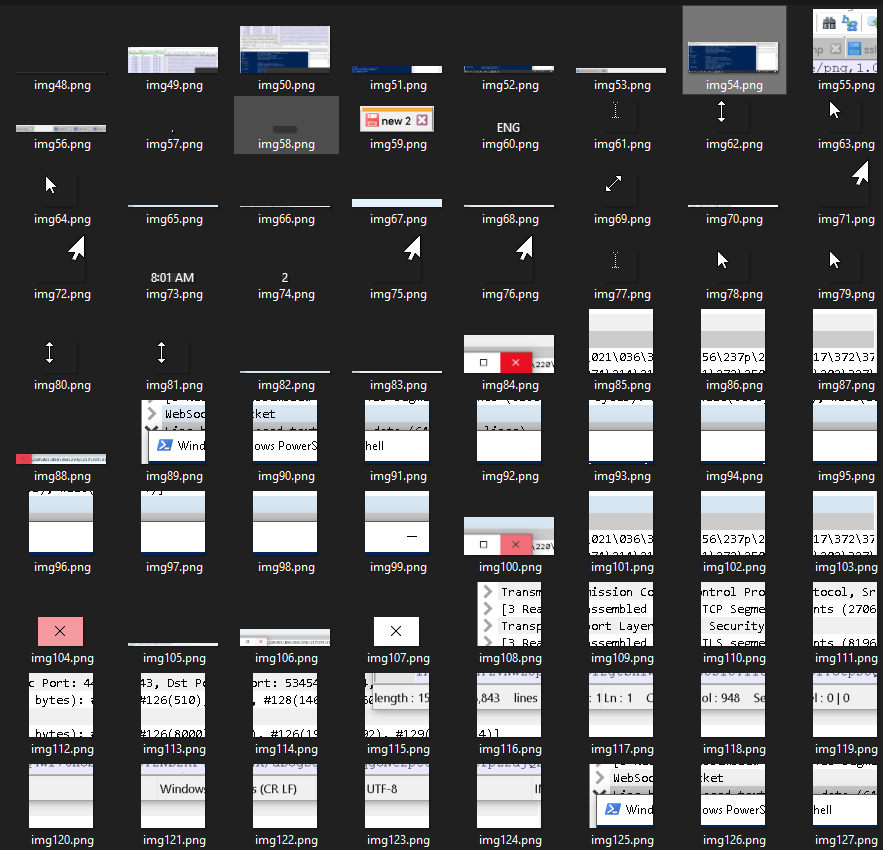
In my case, img49-54 made up the majority of my entire desktop, with the remaining images filling in some gaps and providing updates as my mouse moved across the screen. As you can see, Guac only sends partial images, not the entire screen. As an example: img84, 88, 100, and 104 is all Guac sent when my mouse moved over the X to close a window. Guac then replaces just that square of your screen with the new image, saving significant bandwidth versus sending an entire desktop image with each movement.
Summary
So, if you’re using guac in an unencrypted/decrypted environment, here is what you can see from a packet capture:
- Your guac username and password
- All of your devices listed on the guac main screen
- The exact time and day that you last used each of the devices above via guac
- Proof of active connection to any of these devices
- Your RDP/VNC/SSH/etc password for your remote device
- All keypresses within the guac environment, regardless of if it’s RDP/VNC/SSH/etc
- All mouse movements within the guac environment, with the ability to plot actual paths
- All use and content of the shared clipboard between client and remote server
- All imagery of your session
Note: This is not to say that Guacamole does not support security options that can protect against some of this. I have not yet done a review with different security parameters on my server.