Data Breach Visualization
One of my classmates this week posted a link to a website that I thought did a fantastic job at visualizing the number of type of data breaches that have occurred since 2004. The information it pulls from consists of a variety of good sources such as DataBreaches.net, IdTheftCentre, and various press reports. The information is very current as well, being last updated only just three days ago.
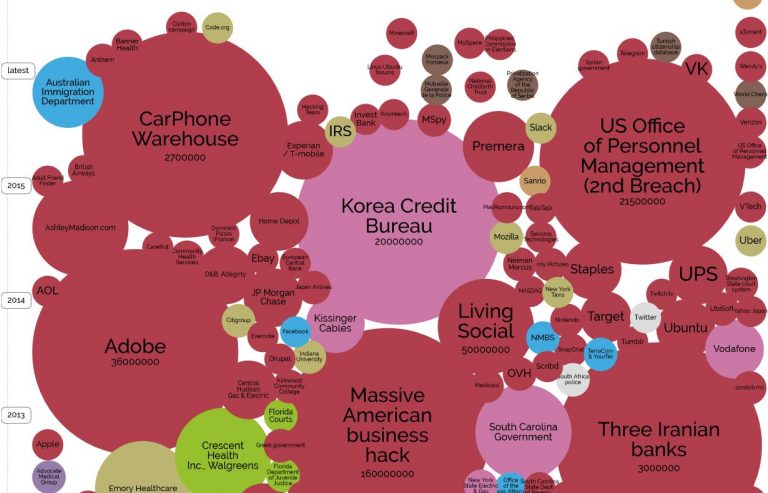
The tool visualizes large data breaches that affected a minimum of 30,000 database records. In the example image above, the size of the bubble indicates the sensitivity of the data that was stolen, which can be correlated to the impact of the breach. The color of the bubble indicates the method of attack, with red being a hacking-based attack and pink being a malicious insider. The website provides a color key for the remaining colors as well.
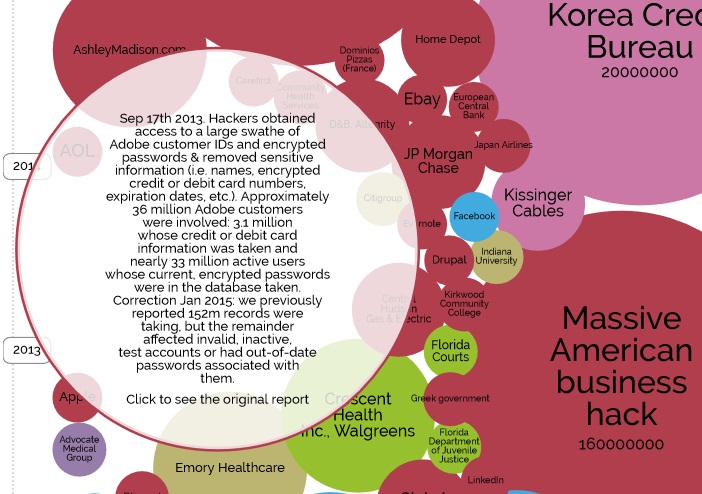
You can change the visualization based on what you want it to show as well. You can change the size of the bubble to be based on number of records affected instead of on sensitivity. You can change the color to be based on the year of the attack instead of the attack method. You can change the x axis as well to sort by sensitivity instead of just alphabetical order. Finally, you can click any of the bubbles shown to get a detailed description of each incident, such as for the Adobe bubble below, as well as get a link to the full, original report for further details on the breach.
A lot of control is at your fingertips, making this a very flexible and powerful tool to show your coworkers or employees to demonstrate how many attacks are occurring every year and how much impact each has had. You can find the website at: http://www.informationisbeautiful.net/visualizations/worlds-biggest-data-breaches-hacks/